By and large, the Department for Transport’s latest National Travel Survey (NTS) tells us that cycling in England has stagnated.
As I’ve mentioned in a separate blog, this makes Cycling UK even more convinced than we already were that our funding for cycling and walking campaign needs everyone to take action now and help get us out of this rut.
There’s another, rather different, statistical source on 2018 just out too, though: The Active Lives Survey (ALS) cycling and walking material.
What makes the ALS special is its local data, which means we can look at every local authority area in England to see how cycling and walking is doing in each of them. The survey’s only been running since 2015-2016, but now that it spans three years, we can make a little more of it trend-wise.
Cycling frequency
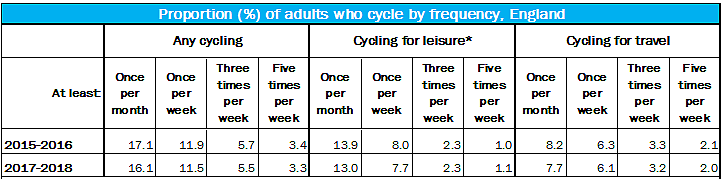
Sorry to report, but the ALS news on cycling frequency is even more disappointing than the NTS revelation that cycling at least once a week has flatlined at 14% over the last three years.
The ALS found what the DfT calls a ‘statistically significant decrease’ – a fall from 12% in 2015-16 to 11% in 2017-18.
Most frequencies have, in fact, decreased. The only exceptions, both for leisure, are three times a week (no change); and five times a week (a small increase).
* Cycling for health, recreation, training or competition, not to get from place to place. This includes using an exercise bike indoors.
Source ALS table CW0302.
Gender diversity
How about gender diversity in cycling?
The NTS figures fluctuate a little from year to year, but overall report that males tend to cycle around 2.5 to three times more trips than females.
The ALS’s data on cycling at least once a week more or less backs this up – it suggests men cycle at that frequency, making around 2.3 times more trips than women.
Clearly, women seem persistently more reluctant than men to cycle, and we know that road safety concerns contribute to this.
Again, a financial boost from Government is bound to make a positive difference here. Take action now!
Drilling down more locally
Now for what the ALS suggests is happening regionally and locally.
The survey monitors four frequencies of cycling, but to be consistent, I’ll stay with ‘at least once a week’. Consequently, the proportion of people who said they did any cycling at least once a week ranges from 3.4% (Havering) to an impressive 57.5% (Cambridge).
For ‘leisure’ it ranges from 2.3% (Hillingdon) to 22% (Isles of Scilly – very small sample, though – Cambridge is next at 19.5%); and for ‘travel’ from 0.6% (Havering and Wellingborough) to 52% (if you’re thinking Cambridge, you’re right).
Note: in the ALS context, ‘travel’ means getting from place to place, e.g. commuting or going to a friend’s house, but the NTS classifies the latter as leisure.
Regions
Between 2015-16 and 2017-18, Eastern England saw a ‘significant decrease’ in the proportion of residents who cycled at least once a week (a drop from 14.1% to 12.9%).
The North West suffered similarly over the one-year period between 2016-17 and 2017-18 (10.6% down to 9.8%).
It was no change for all other regions.
Counties, Unitary and Metropolitan authorities
It was no change too for most of the 89 shire counties, unitary and metropolitan authorities.
There were, regrettably, ‘significant decreases’ in eight of them over the survey’s three-year timespan though for: Blackpool, North Lincolnshire, Telford & Wrekin, Luton, Hertfordshire, Norfolk, Medway and West Sussex.
Note: whether or not an increase or decrease is significant has been determined by the DfT’s statisticians.
Districts, boroughs and city councils
For most lower tier authorities (270), the ALS comes up with ‘no change’ yet again, apart from four ‘significant increases’ – yay! – for Stratford-on-Avon, Brent, Shepway and Barnsley.
I’m particularly pleased for Barnsley. It was right at the bottom with 4% in 2015-2016 – that figure’s more than doubled to 8.1%.
Sadly, these successes are outnumbered by thirteen ‘significant decreases’: Lancaster, Chesterfield, North Warwickshire, Wolverhampton, Wyre Forest, Broxbourne, East Hertfordshire, Watford, South Norfolk, Mid Suffolk, City of London (small sample caveat), Hammersmith & Fulham and North Devon.
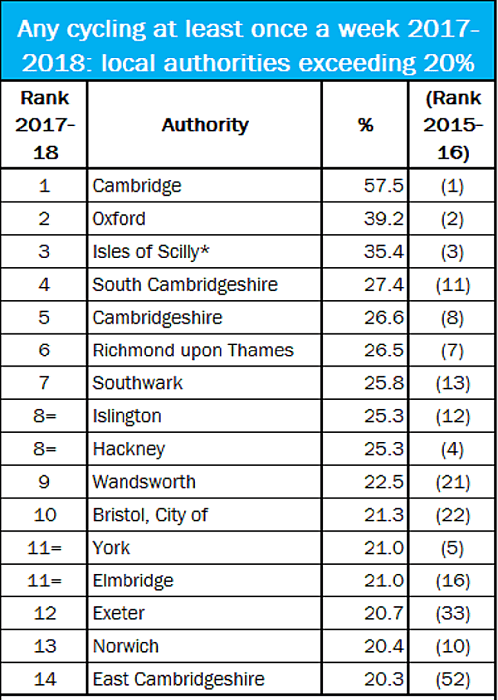
Over 20%
I mentioned significant change before going into rankings because all upturns in cycling are worth celebrating, wherever the authority sits in a largest to smallest list.
Still, here are all the authorities (of any tier) whose ‘any cycling at least once a week’ results come in at more than 20%, each with its standing for 2015-2016 in brackets:
*The sample size is very small.
I felt so mean cutting off the next few 19%+ authorities, that I’m going to mention them too: Oxfordshire (19.9%); Hammersmith & Fulham (19.8%); Portsmouth (19.7%); Brighton & Hove (19.6%); Gosport (19.6%); Kingston upon Thames (19.3%) and Purbeck (19.2%).
I feel equally mean missing out the plus 18 percenters (Rushcliffe, Guildford and Chichester), but I’ve just got to stop somewhere. Anything over 11% or so is above average.
Note that Hammersmith & Fulham, which does very well in these standings, is also listed amongst the ‘significant decreases’ above.
As mentioned, Havering is bottom with 3.4%. Other authorities struggling to beat 5% too are: Wellingborough (4.3%), Medway (4.5%), Harrow (4.5%), Wolverhampton and Barnet (both at 4.8%).
Patchiness
As you’ll see from the above, some authorities do very well by cycling, others do very poorly and the difference between the top and bottom ranks is vast.
ALS data can’t tell us why this is and, in any case, many factors may be involved to some degree or other in each council area – demographics, health profile, topography, settlement patterns, the extent of pro-active travel political will, to cite just a few.
Nevertheless, a good many of the places that are doing well have received funding for active travel from central Government, e.g. Cambridge (which, of course, has been famed for many years for its high levels of cycling, as is Oxford). Bristol, York, Exeter, Brighton & Hove and Norwich have also successfully bid for grant money.
That leaves hundreds of other councils having to finance cycling and walking without much central help. Hence our funding campaign which calls for government to provide ring fenced funding for local authorities: take action now!
Do you know something we don’t?
Have you any ideas why your local council is doing well, just ticking along, taking a dive or has never got going on cycling? Do get in touch – I’d welcome your theories.
Two surveys?
You may be wondering why the NTS and ALS don’t mirror each other more exactly. The answer is that their methodology and motivation aren’t entirely the same:
- The NTS is: based on household interviews and diaries; covers all ages; looks at most modes of transport; has been going since 1988; and has a sample size of 14,000;
- The ALS is: based on a ‘push-to-web’ online or paper questionnaire, designed for self-completion; covers people aged 16+ only; looks specifically at walking and cycling; offers three years’ worth of data (2015-16 to 2017-18). and has a sample size of 180,000.
Another difference is that the ALS is administered by Sport England, who take a healthy interest in an activity’s ‘intensity’ (e.g. if it made their respondents out of breath). ‘Intensity’, however, doesn’t make its way into the NTS.
Take action now! Let’s make Cambridge typical!
I’ve mentioned our funding campaign several times now, and make no apology for mentioning it again.
We must persuade the Government to put more money into active travel so that the levels of cycling in Cambridge and its near rivals become typical rather than exceptional.
Please take action by emailing the politicians who could help turn all these ‘significant decreases’ into ‘significant increases’. It’ll only take a couple of minutes.
- The Active Travel Survey results in full are available on the DfT’s website.