“Network planning” is not exactly a phrase that gets the pulse racing for most people. Mention it to your average person in the street and you can expect one of two responses; a puzzled, blank expression or a sullen face like that of someone trapped in a lift with an in-law that has a passion for collecting paperclips.
But for cycling, it need not remain a banal obscurity. Every day we travel on networks – whether by train, foot, car or a combination. And it's no different for cycling, however these networks tend to be fragmented and evidence suggests that this may be one of the biggest barriers to everyday cycling in Britain.
So, if we can get past the jargon, “network planning” may become a phrase we add to our lexicon. Perhaps it needs a refreshed, punchier name. To take heed from the teenagers of the mid-noughties, how about a “happy map”? After all, evidence that cycling increases happiness is well documented. Whatever works for you, these happy maps, or network plans, are going to become the cornerstone for our Space for Cycling campaign in the years ahead.
Keep it local
Local campaign groups across the country have started producing these maps. Using their insight and experience as people who cycle regularly, they are starting to clearly illustrate to their council where a network of high-quality cycle infrastructure is best prioritised.
I didn’t expect the level of political engagement I received. I had Councillors on the phone, working with me to accurately portray the map. The key was creating something that simplified a very complex network into something even a child can understand.” Adam Reynolds, Cycle Bath.
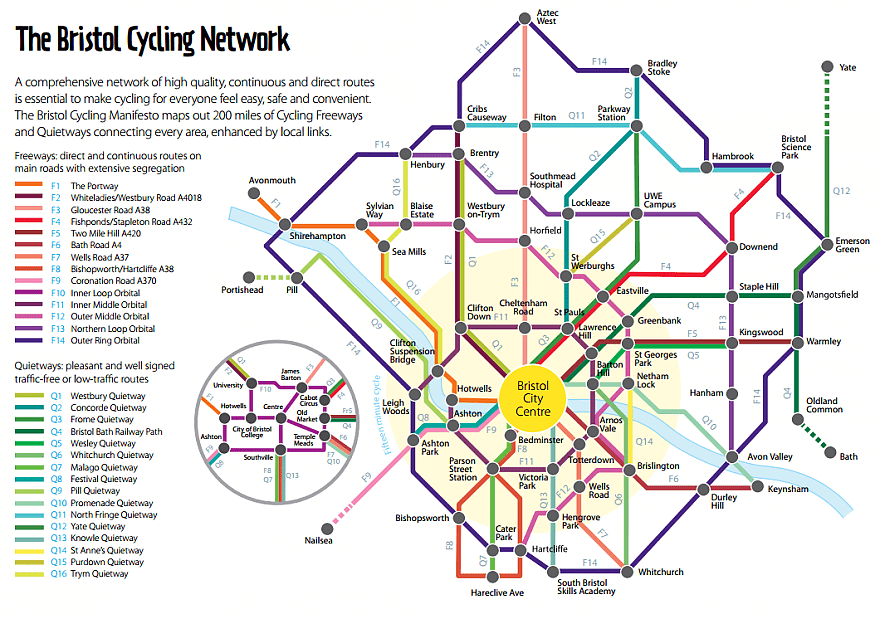
By using an easily navigable “tube map” format, local groups have been able to capture the imaginations of local press, politicians and public alike. In 2014, the Bristol Cycling Campaign drew up the first of these maps, clearly illustrating where they believed council money for cycling would be best spent.
Using Google Maps, they started by highlighting key routes following the most direct lines on the best gradients. These almost invariably followed the main A-Road network. They then filled in some other necessary links but aimed to keep the design simple, so that the map was still recognisably Bristol.
Parts of the network that followed main roads became “protected superhighways”, while parts that followed quiet roads became “quietways”. Using rough estimates that superhighways cost £250k/km and Quietways cost £100k/km, the group estimated their network would cost £109 million over 12 years, amounting to a cost of £16 per head per year. As a result of their hard work, Bristol Council adopted the map as an aspirational target and included it in their Cycle Strategy document.
Eric Booth, Chair of the Bristol Cycling Campaign said; “the aim was to get the ball rolling. Bristol Council had lots of great ideas but we needed to set out a network for them to work towards. By starting the job for them, we helped them begin to realise their ambitions."
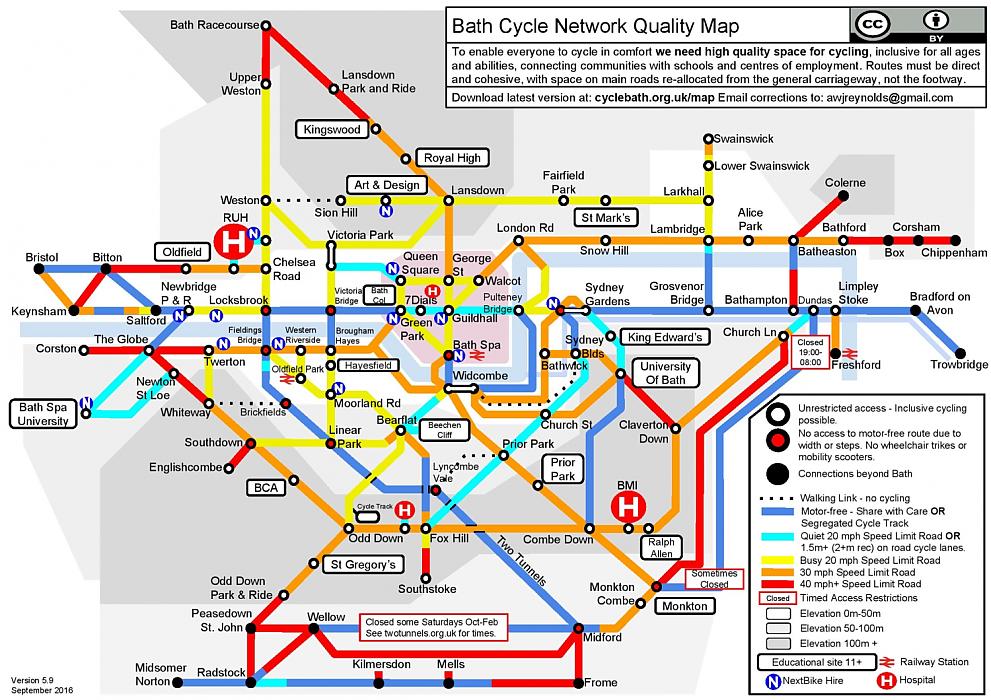
Just down the road, Cycle Bath recently produced its very own Bath Cycle Network Quality Map. Composed using Google Drawing, the Bath map sets out where good quality provision exists but clearly highlights the gaps in the network.
Adam Reynolds of Cycle Bath, and one of the chief designers of the map, said “I didn’t expect the level of political engagement I received. I had Councillors on the phone, working with me to accurately portray the map. The key was creating something that simplified a very complex network into something even a child can understand”.
These maps can be drawn up in a variety of different ways. It is possible just to highlight routes manually on a map and then annotate on Powerpoint to make a neat looking tube style map. Others use tools such as the Propensity to Cycle Tool, which uses data sets to predict where the greatest potential for cycling lies given different scenarios of cycle use.
Over to you - let's plan, invest and build Space for Cycling
Whatever your level of expertise, we can help you produce one of these. Our aim is to get councils across the country to plan, invest in and build high quality cycle networks. By producing one of these maps, you can help them along the first step.
Having reflected on which way seems to be the most straightforward, we think Google's My Maps is the one to try.
If you would like to produce a “Happy Map” or if you have graphic design skills that may help others produce one, please get in touch with Tom Guha.
For more guidance on how to produce these maps, please come along to a Space for Cycling roadshow event near you.


Comments
I would also recommend
I would also recommend OpenStreetMap: http://www.openstreetmap.org/ . This is a community project and does not require sharing your personal data or using other services. It has all the mapping tools you require. It forms the basis of many GPS navigation devices. I use one in Germany which is excellent.
There are many other web sites which use OSM maps, such as http://www.gpsies.com/ .
Happy mapping!
Hi, I made the CycleBath map
Hi,
I made the CycleBath map with the help of a huge number of people. The approach used bing maps, google maps, open street maps, and local knowledge.
Google Draw was chosen as it allows collaboration. I had somebody in Manchester, on the phone, editing the map while I was working on it. Once you get to grips with the idiosyncrasies of Google draw it is easy to play with.
The legend is key. It clearly tells you what the objective of the map is. It's colour blind safe. Had a red/green colour blind councillor on the phone helping me edit the map so it worked for the most common blindness.
Distances are irrelevant. Some lines are kms in length, one is 50m. Do not get hung up on distance and even direction.
The CycleBath map does not tell you HOW to get from A to B, just tells you WHAT the experience will be including if you are going to be riding up hills. I could add small 6pt text along routes to tell people key roads/paths. This may complicate things but might make it more accessible to the general public.
The map also focuses the mind on inclusive cycling. Something that many councils design out of cycle infrastructure but are usually a case of removing a couple of bollards.
I'm putting together a "How To" video in the coming weeks. I'm also happy to jump in and help people with their own maps.
The CycleBath map is Creative Commons BY which means you can copy the google draw document and do whatever you like with it.