Get started
To access the template, go to goo.gl/oHu0xA.
Ensure you are logged into Google/Gmail. If you don't have an account, you will need to set one up.
Go to 'File'> 'Make a copy' and you will be given an identical template that you have full editing rights to. You can copy elements from the template to make your own.
It saves automatically and will be stored in your Google Drive.
We recommend that you read the following guide to understand better how the tool works. If you need more help there’s a step-by-step video guide at the end of this page.
What is a ‘tube map’?
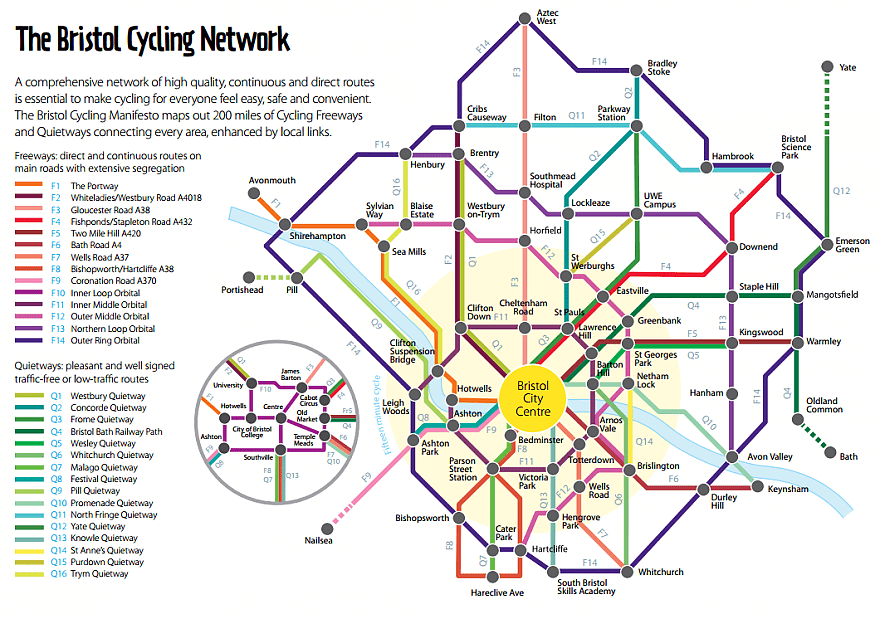
Cycle tube maps are a useful lobbying tool to illustrate easily to local decision-makers where a desired network of infrastructure would be best placed and what the current quality of the network is.
Local authorities across the country are being asked to draw up network maps to support funding bids. By drawing a tube map, you are starting the work for your local authority.
Background
The first ‘tube map’ was created by the Bristol Cycling Campaign in 2015. Since creation, the map has become a part of the Bristol Council Cycling Strategy.
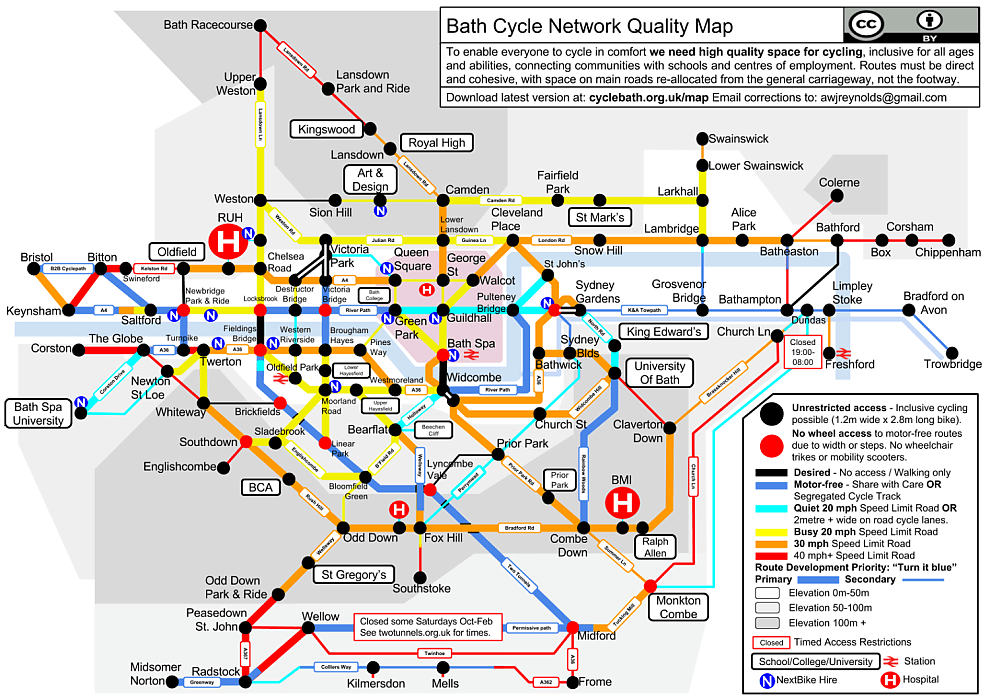
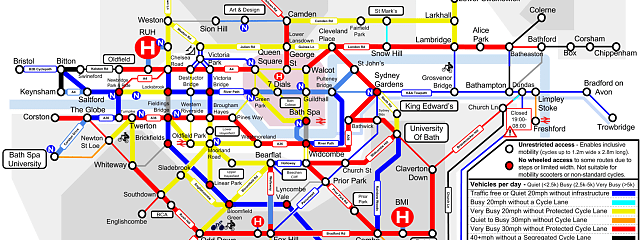
The idea was then built on by CycleBath, who created a map that shows the quality of routes as well. The message of the map is “turn this network blue!”
Make your own
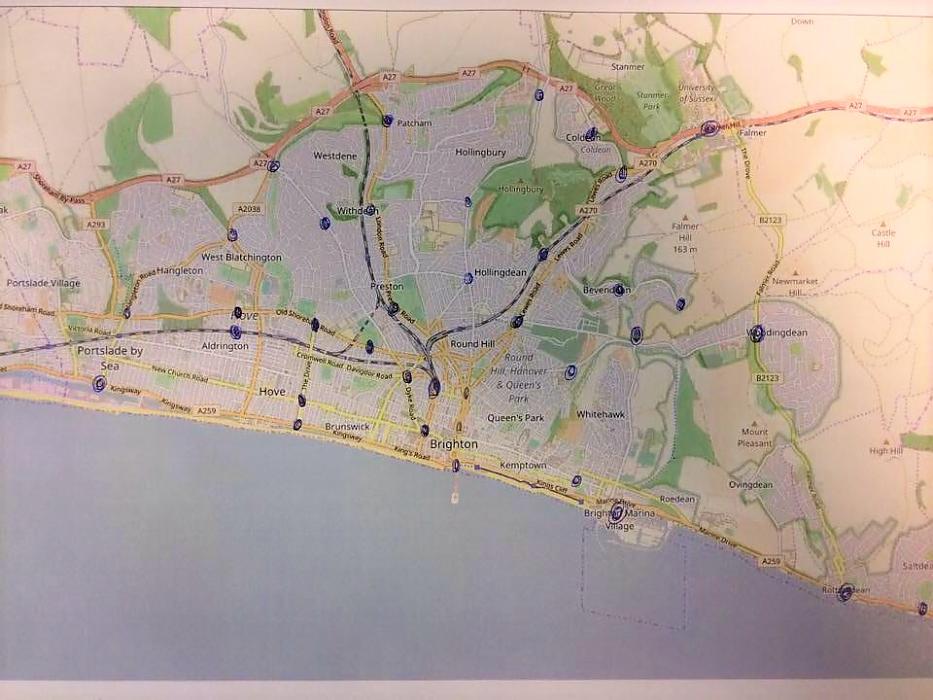
Start with a paper map of the area in question. You can generally get good quality maps from your local authority or tourist offices. Or you can simply print off an Open Street Map (preferably A3 for greater detail/clarity).
Mark in pencil/pen all the major hubs on the map – these will become the ‘nodes’ (stations) on your tube map. Include residential areas, business areas, schools, universities, hospitals and so on – any places that people travel to. Places like schools and business areas are particularly important because you can get parents, teachers and business owners to support your map once it is created.
Remember – you are mapping where people would like to cycle for utility journeys, as well as where people currently cycle. So when creating your network, think about what a family with young children would want, not what a foolhardy veteran cyclist would want.
To help you find places, search in Google maps (for example, ‘schools’) and it will show you all the schools in the area.
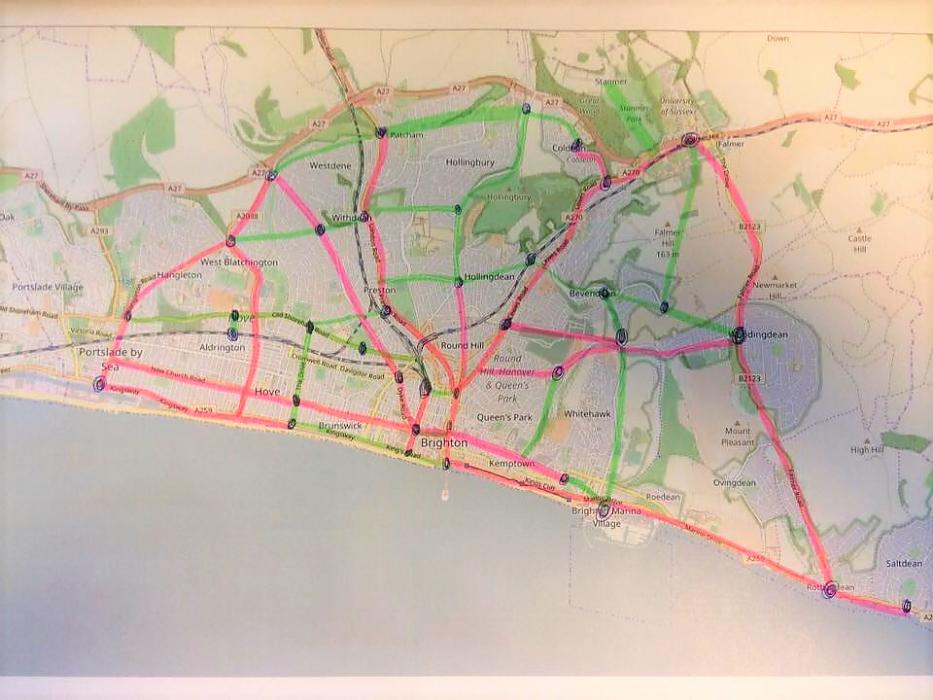
Once you have placed your nodes, get a highlighter pen and join them up using the most direct routes possible. This will invariably follow the main road network, though you also want to include some orbital routes which may follow quieter streets.
Once you have drawn a network you are content with, you can take it to the online template. Remember, it doesn’t have to be perfect at this point – you may find your routes and nodes change quite frequently in the early stages of development.
Optional steps
Some groups have done research to inform their map. This could be done by calling a meeting of local cyclists and campaigners and gathering thoughts. You could also canvass local people – ask families, local cyclists and so on. You could also create an online survey.
If you live in England, you may want to try using the government-funded Propensity to Cycle Tool (PCT), which shows potential cycle flows under different scenarios of cycle use.
Whatever research you do, make sure you document it so that you can show it to the people you are trying to influence.
The template
Go to the online template (same as at top of this guide) and select ‘File’ > ‘Make a copy’. Change the name so that includes the place name. You will then be directed to a template that you have full editing rights to.
The template saves your progress as you go. You will be able to find it in your Google Drive. You can also invite people to work on the map in real time with you by clicking ‘share’ in the top right corner and entering their email address. Make sure you give editing rights (if you want people to edit).
Before drawing, be aware that all the elements in the template can be selected, copied, moved around and deleted. Have a play with it, you can always click ‘undo’ afterwards (as you can if you make any mistake while creating your map). You can also make as many copies of the map as you like, so don’t worry about messing it up.
The zoom function is key. To zoom you can either go to ‘View’ > ‘Zoom in‘/‘Zoom out’ or use shortcuts CTRL ALT + (zoom in) or CTRL ALT - (zoom out). Having the appropriate level of zoom makes it easier to select the element you want to select. It can be quite awkward otherwise.
When you want to get started, you may want to move the existing grid out of the way so that you have more space for your own. To do this, select it all and drag it aside. Don’t delete it! It is there so that you can copy and paste it to make your own, or use it to build your from.
You can do likewise with the ‘design tips’ at the bottom, just make sure you read them or put them somewhere safe!
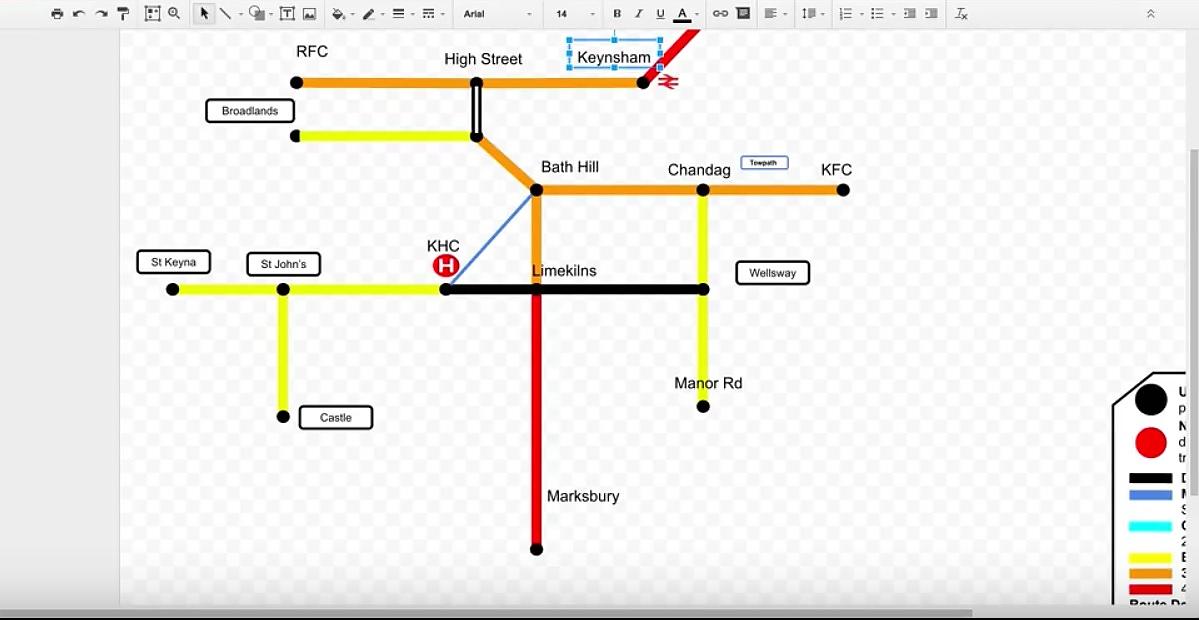
Constructing your network on the template
Nodes
Zoom in and select a node. Copy it (CTRL C) and then press paste (CTRL V). A new identical node should now be sitting next to the existing one. Drag the new node into position. To help with placement, use ‘View’ > ‘Snap to’ > ‘Guides’. This will help you see where your new node sits in relation to the rest of the grid.
Remember – you are making a tube map! Your nodes should not be geographically accurate: keep them horizontal, vertical or diagonal. Don’t worry about them being perfectly placed at this point – you can fix them later.
You can move nodes around either with your mouse or the arrow keys on your keyboard. Holding shift while using the arrow keys moves it more gradually.
To give the node a name, select ‘Text box’ from the top bar. Draw the box above the node and type in the name (such as ‘Town centre’). Keep the text box as small as possible (keep the text size at the original size but ensure the box boundaries are as close to the text as possible). If it is too big, it may get in the way when you try to select other elements.
You can also copy and paste the train station/hospital symbols to put in place above nodes.
Repeat this until you have a full grid of nodes that now need connecting up with lines.
Lines
Create lines in the same way as nodes – select, copy, paste.
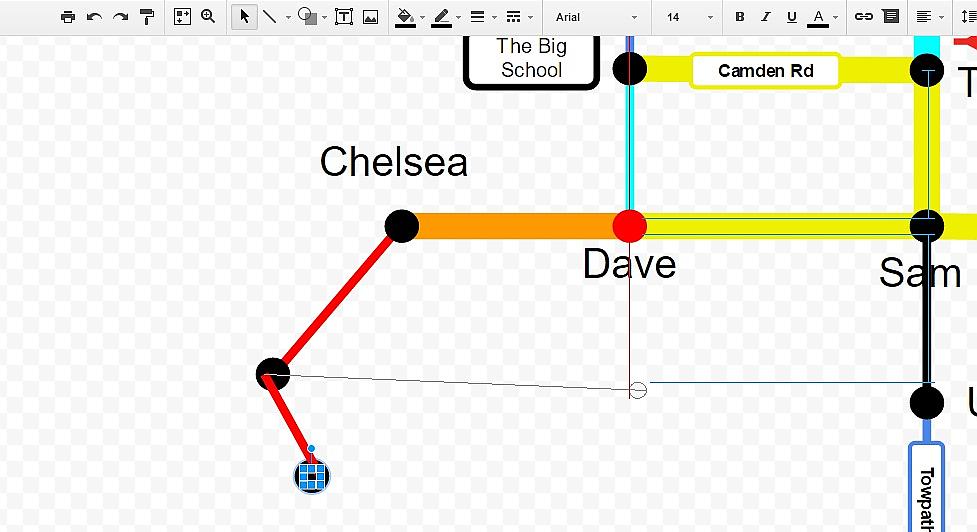
Drag the new line over to the two nodes you want to connect. Then select the line so that you can see a thin blue line running through the middle of it with two small blue circles at the end.
For this next part you will need to be well zoomed in.
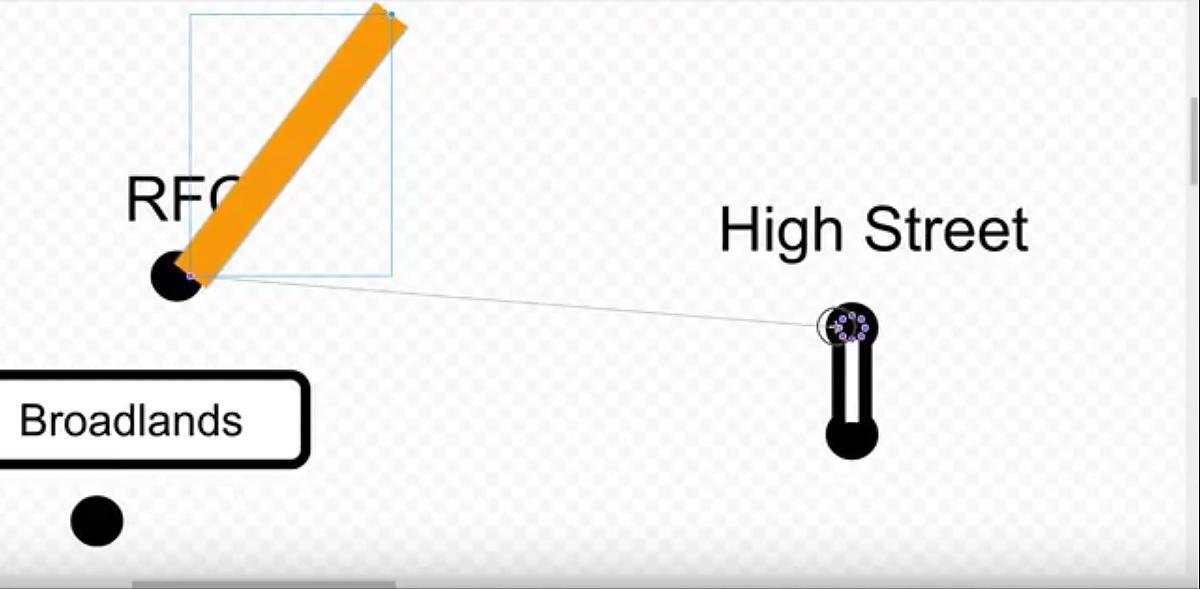
Select one of the blue circles and drag it over to one of the nodes. As it approaches, a ring of small purple circles should appear on top of the node. Connect the blue circle belonging to the line to the relevant purple circle on the node (the one on the side that you want to connect). You will know they have connected when the blue circle turns purple. Now repeat, connecting the other side of the line to the other node.
You should now find that when you move the nodes around, the line moves with it.
Repeat this process with all the nodes you want to connect. You should now have a grid that needs to be colour coded and tidied up.
Tidy it up and colour it
To tidy your grid, select a line and go to ‘Arrange’ > ‘Order’ > ‘Send to back’ or use shortcut (CTRL SHIFT ↓). You can select multiple lines by holding CTRL while you select them but this can get messy!
Now you need to position your nodes so that they are either horizontal, vertical or diagonal.
To snap your network to the grid go to ‘View’ > ‘Snap to’ > ‘Grid’. Now select a node and drag it into place. You should notice guiding lines indicating the angle at which the selected node is connected to its neighbours.
Connect it in a perfectly horizontal/vertical/diagonal fashion and repeat this process until you have reached a tube map shape.
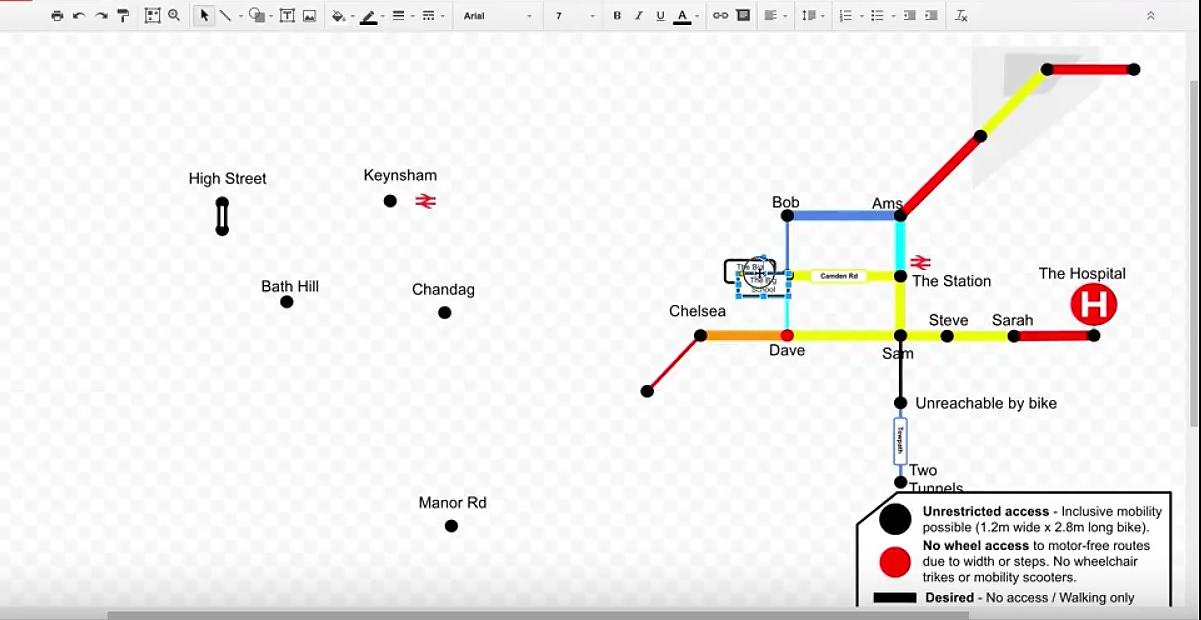
You should now have something that resembles a tube map albeit all in one colour. You need to change the colour of the lines and nodes to correspond with the key.
To do this, select the relevant component and then click ‘line colour’ in the top bar. Change the colour of the line so that it corresponds with the key. All the colours you need are in the second line down (the first line under the grey scale colours) once you select ‘line colour’ except the yellow, which is the custom yellow at the bottom.
Details
You may want to add in shading to denote hilliness and other details. All of these things are in the original template. All you have to do is copy, paste and put them in place. Make sure you ‘send to back’ these sorts of details.
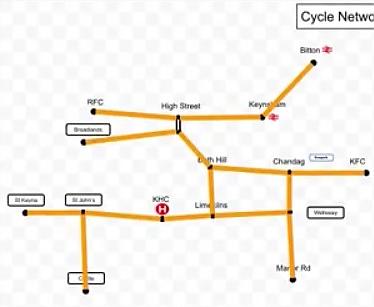
Finish
You now have a tube map! Ask other cycle campaigners and local cyclists, families and other interested parties for their views. You may find it continues to evolve over time.
Once it has reached a stage you are happy with, print out copies and hand them out, send them to councillors, local businesses and so on, and ask them to support your campaign.
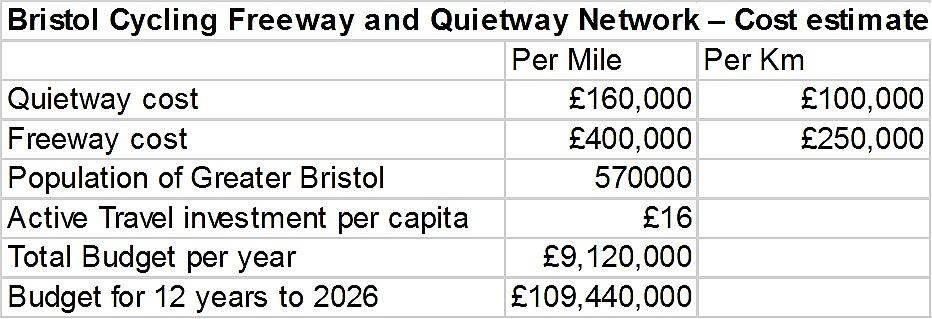
You may wish to try to cost your network. The Bristol Campaign used the following (very rough!) figures to devise the figure of £16 per head over eight years to build their network. As a result, Bristol City Council agreed to allocate the necessary funds.
And don’t forget, if your council does upgrade the network and start turning the map blue, make sure you pat them on the back and change your map accordingly!
For more details on how to use the map template, view this video. It is 30 minutes long but may help you overcome some of the awkward aspects of the grid. Also, don't hesitate to get in touch!
Watch the step-by-step video