Police statistics collected and just published by the Department for Transport (DfT) tell us that: 99 cyclists died on Britain’s roads in 2018, two fewer than in 2017 (-2%); 3,707 were seriously and 13,744 slightly injured.
Altogether, this means that 17,550 people who chose to cycle were hurt in some way and that 0.6% of these casualties lost their lives.
When you think about the 3.3 billion miles accumulated by everyone who cycled over the year, these figures also tell us that cycling is much more likely to improve the health than damage or threaten it
Cherry Allan, campaigns information officer
When you think about the 3.3 billion miles accumulated by everyone who cycled over the year, these figures also tell us that cycling is much more likely to improve the health than damage or threaten it.
After all, research suggests that the health benefits of cycling far outweigh the risks by anything from 13:1 to 415:1 (depending on the factors considered); and there’s one fatality over a distance equivalent to 1,000 rides around the world at its widest point.
Disproportionate risks
That said, all road deaths and injuries are intolerable. So is the fact that, more often than not, the victims are vulnerable: people travelling by cycle, motorbike or foot.
Cycling
To focus on cycling, here are cyclists’ share of overall casualties among all road users:
- 5.5% of fatalities
- 14.5% of serious injures
- 10.3% of slight injuries
- 10.9% of all casualties
Yet cycling only accounts for less than 1% of road traffic and under 2% of trips.
Car traffic
Now consider the much higher volume of car traffic – a huge 77% of total mileage in GB – and compare it with casualties among car occupants. This group represented:
- 43.6% of all fatalities
- 36.6% of serious injuries
- 62.9% of slight injuries
- 58.5% of all casualties.
The proportion of casualties who were riding their bikes thus exceeds their share of traffic volume, whereas the proportion of casualties who were travelling by car is less than their share of traffic volume.
Mile for mile, then, cycle users were far more likely to appear in road casualty statistics in 2018 than car occupants. The same is true for pedestrians and motorcyclists. It has been like this for years.
Risk per billion miles
Until 2016, we could easily work out if the risk of being killed or seriously injured (KSI) per billion miles cycled had been going up or down over the previous 10 years.
This is always worth doing as risk per mile is a much fairer way to measure progress on safety than looking simply at absolute numbers. More casualties may reflect the fact that more people are cycling, not that cycling is growing less safe, for example.
Figures covering the eight years between 2008 and 2015 suggest that the risk was generally upwards (+14%), but we can’t compare them with subsequent data. This is because a good many police forces have since introduced new reporting systems that make them more likely to record injuries as ‘serious’ as opposed to ‘slight’.
Data from 2016 and beyond, therefore, are not like-for-like with data from earlier years and they’re not comparable.
To take account of this, the DfT offers ‘adjusted’ figures in some of its statistical tables, but not all. Otherwise, it says: “The number of pedal cyclists killed or serious[ly] injured in Great Britain has increased by 21% from 2008 to 2018 (using the series adjusted for changes in severity reporting). This is partly explained by an increase in pedal cyclist traffic in Great Britain of 17% from 2008 to 2018”.
Nevertheless, we’ll have to wait for a while until we can measure trends over a five- or 10-year timespan with data that we don’t need to adjust.
In the meantime, we can at least look at the last three years and the relative risk that road users have faced per billion miles. According to the DfT:
| Relative risk of different forms of transport: casualty rate per billion miles, GB, 2016-2018 |
| |
Killed |
Killed or seriously injured (KSI) |
| |
2016 |
2017 |
2018 |
2016 |
2017 |
2018 |
| Car driver |
2 |
2 |
2 |
26 |
25 |
27 |
| Pedal cyclist |
30 |
31 |
29 |
1,011 |
1,160 |
1,139 |
| Pedestrian |
35 |
35 |
34 |
442 |
446 |
461 |
| Motorcycle rider |
111 |
119 |
126 |
2,001 |
2,061 |
2,039 |
Source: DfT Reported Road Casualties GB 2018, Table RAS30070
From this, we can conclude that motorcyclists are most at risk and car drivers least; and that the risk of being killed per mile is higher for pedestrians than it is for people who cycle, although it’s the other way round for KSI and by a much greater margin; and that, overall, the risk for vulnerable road users is far greater than it is for people inside cars.
Contributory factors
When the police attend a road traffic incident and fill in the required form (STATS19), they have the chance to record why they think it happened. The DfT in turn publishes this ‘contributory factor’ (CF) data in its annual casualty report.
This doesn’t (and can’t) reflect the findings of any subsequent forensic investigation or court case, which may establish who was at fault, but it does give us reasonable insight into the likely causes of collisions. Bear in mind that by no means all incidents are reported to the police and end up in these stats.
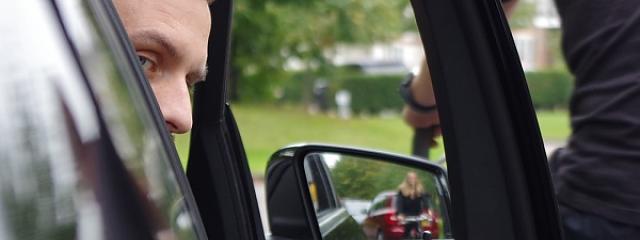
Top of the list in 2018 is ‘failed to look properly’ – 33,879 drivers/riders had this logged against their vehicle type, representing 21% of the vehicles involved in collisions attended by the police and in which a ‘contributory factor’ was reported. This factor has outstripped all the 77 others for years by far.
Next down is ‘failed to judge other person’s path or speed’; 11% in 2018. ‘Careless, reckless or in a hurry’ is never all that far behind, and neither is ‘poor turn or manoeuvre’.
The DfT’s data on ‘contributory factors’ also help us counter the myth that cyclists are more likely to contribute to a collision than other road users. In 2018, as in other years, around half of cycles involved in incidents in which a ‘contributory factor’ was reported had no ‘contributory factor’ logged against them.
The only vehicle type that did better in the incidents that involved them were buses and coaches (55% with no CF), with the rest as follows: motorcycles 33%; cars 42%; van/light goods 41%; and HGVs 46%.
Involvement
The latest statistics also allow us to find out what other vehicles were involved in incidents in which someone riding their bike was hurt. From this, we discover – unsurprisingly – the majority of KSI cyclist casualties in 2018 (90%) happened in a collision involving a motor vehicle. Most pedestrian KSI involved a motor vehicle too (98%).
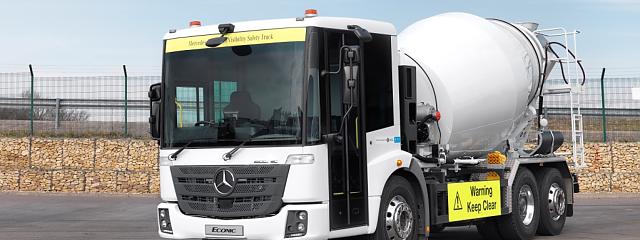
Almost a fifth of cyclists’ fatalities involved HGVs, a huge proportion given that lorries only make up a tiny proportion of traffic (5%).
The most vulnerable
Children who walk and cycle are among the most vulnerable groups of road users.
Sadly, in 2018, child pedestrians under 11 years old suffered a rise in KSIs when compared with 2017 (+7%):
| Reported killed or injured child pedestrians, GB, 2010-14 average, 2017 and 2018 |
| Age |
2017 |
2018 |
2010-14 average |
| 0 to 4 |
151 |
163 |
208 |
| 5 to 7 |
188 |
201 |
251 |
| 8 to 11 |
397 |
423 |
464 |
Although the figures for the last two years are all below the 2010-14 average, increases like this are always worrying and the thought that they might mark the start of a trend is deeply alarming. The rise doesn’t seem to be matched by an upturn in children walking, if the latest results for the proportion of pupils usually travelling to school on foot are anything to go by.
There were slightly fewer KSIs among child cyclists in 2018 than there were in 2017, and both of these years’ figures were below the 2010-14 average:
| Reported killed or injured child cyclists, GB, 2010-14 average, 2017 and 2018 |
| Age |
2017 |
2018 |
2010-14 average |
| 0 to 4 |
4 |
3 |
4 |
| 5 to 7 |
22 |
20 |
27 |
| 8 to 11 |
88 |
82 |
98 |
Source for the above two tables: DfT Reported Road Casualties GB 2018, Table RAS30011
Let’s hope the trend is towards zero and it’ll encourage more young people to cycle to school, which so very few of them now do.
Just possibly, though, there are signs of hope already: according to the National Travel Survey, 2.9% of 5-10 year olds were making the school run by bike in 2018, more than in 2017 (1.8%) and, in fact, more than for years and years. The numbers here are so small, though, that we must remain wary of year-on-year fluctuations.
To conclude
Change usually takes its time. But change for cycle safety is taking an awful lot of it.
As the DfT comments: “Although the number of pedal cyclists killed on the roads in 2018 was slightly lower than in 2017, the 99 fatalities is very similar to the level seen since 2008. Any changes since that point are most likely to be as a result of natural variation and cannot be attributed to underlying causes.”
What we’re looking to see is the day when there’s no need to cite ‘natural variation’ alone in the context of cyclist casualties; the day when we’ll be able to attribute a significant, zero-bound fall in numbers and rates to measures designed to tackle the common causes of collisions and prioritise them.
This means wiping out substandard driving, poor infrastructure, speeding and hostile road conditions, as Cycling UK stressed to the DfT last year in our response to its Cycle Safety review.
Tackling these hazards will also help reduce those off-putting ‘near misses’ that don’t appear in casualty statistics.
Reducing casualties is in itself a contributory factor. It’s crucial to our principal mission to encourage more people to travel actively for the sake of public health and the environment. But stagnation is mostly the tale for cycling levels, too.
The solution is much higher levels of central funding. This means keeping up the pressure on politicians not only to see the sense of diving a lot deeper into the public purse for active travel, but to actually do it.
- See the DfT’s website for Reported Road Casualties Great Britain 2018, published 26 September 2019. It includes incidents that were reported to the police and occurred on a public highway involving at least one motor vehicle, horse rider or pedal cyclist, and where at least one person was injured. It excludes: incidents that happened on private land (including private drives) or car parks; and damage only incidents that didn’t result in personal injury.